Sessions to Conversion Distribution Chart
The Sessions to Conversion Distribution chart shows how many sessions customers need before converting—revealing whether conversions happen on the first visit or require multiple return visits.
Quick start
1. Select a domain and optionally a path
2. Look for the dominant bucket (where most conversions occur)
3. Compare device stacks to spot device-specific patterns
4. Hover over bars for detailed breakdowns
Understanding the chart
The chart displays a stacked column for each session bucket, with colours representing device types. Each column shows the percentage of total converting sessions that required that number of sessions to convert.
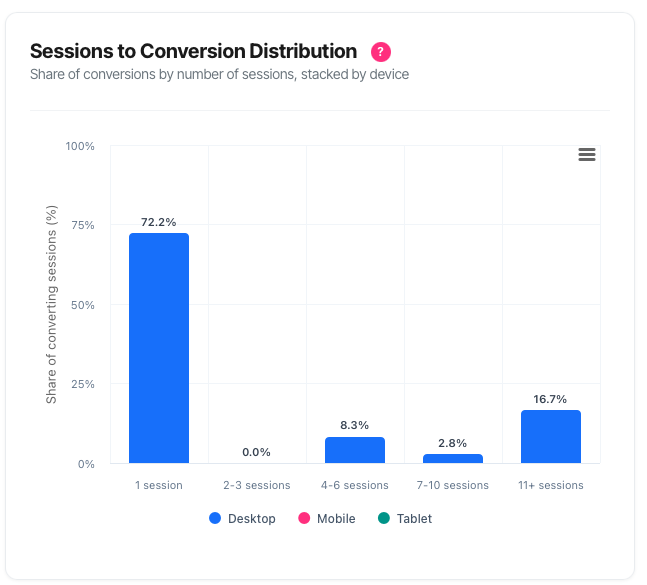
Session buckets
| Bucket | Meaning |
| 1 session | Converted on the first visit. Single-session converters. |
| 2–3 sessions | Returned once or twice before converting. Light consideration. |
| 4–6 sessions | Multiple return visits before conversion. Moderate consideration. |
| 7–10 sessions | Extended engagement before conversion. Heavy research. |
| 11+ sessions | Many visits before converting. Very long consideration cycle. |
Device stacking
Each bar is stacked by device type, showing Desktop, Mobile, and Tablet contributions. This reveals whether session requirements differ by device.
Reading the Y-axis
The Y-axis shows 'Share of converting sessions (%)'. Each bar represents the percentage of all converting sessions that required that number of sessions. All bars together total 100%.
What should I do next?
| If you see... | Then... |
| Most conversions in 1 session | Visitors convert immediately. Focus on first-visit experience and strong CTAs. |
| Spread across multiple buckets | Mixed buying behaviours. Consider segmenting by product type or customer value. |
| Significant 4+ session conversions | Customers research extensively. Invest in retargeting and email nurture. |
| Mobile needs fewer sessions than Desktop | Mobile users decide faster. Ensure mobile experience supports quick decisions. |
| Desktop needs more sessions than Mobile | Desktop users research more thoroughly. Provide detailed comparison tools. |
| High 11+ sessions bucket | Very long engagement required. Review if these are high-value or low-intent users. |
Using the tooltip
Hover over any bar segment to see detailed information including total converting sessions for that bucket, the percentage of all conversions, and the breakdown by device.
Exporting the chart
Click the menu icon (☰) in the top-right corner to export the chart as PNG, JPEG, PDF, or SVG. The export captures the current view with all data visible.
Troubleshooting
Chart is not visible
The Sessions to Conversion Distribution chart requires cookie-based tracking. If the domain uses cookieless tracking, the section is hidden. This is because tracking sessions-to-convert requires visitor journey data that cookieless mode doesn't capture.
'No converting sessions found'
No conversions occurred in the selected date range and filters. Try expanding the date range or removing restrictive filters.
Most conversions appear in '1 session'
This is common for many businesses. It indicates customers convert quickly without needing multiple visits. This is typically positive—it suggests effective first-visit experience.
FAQ
How is 'sessions to convert' calculated?
Sessions to convert counts the number of tracked sessions from the visitor's first interaction to their conversion. A visitor who arrives Monday, returns Tuesday, and converts Wednesday has 3 sessions to convert.
Why might the same visitor appear in different buckets?
This chart shows session-level data. If a visitor converts multiple times in different sessions, each converting session has its own sessions-to-convert value based on the journey to that specific conversion.
What's the difference between this and 'Days to Conversion'?
Days to Conversion measures calendar time elapsed. Sessions to Conversion measures visit frequency. A customer might take 30 days but only 2 sessions (browsed once, returned a month later). These metrics reveal different aspects of the buying journey.
Why do percentages add up to 100%?
The chart shows each converting session once, placed in exactly one bucket based on its sessions-to-convert value. Every session belongs to exactly one bucket, so percentages total 100%.